APURVA PRAKASH
MUKUL GUPTA
Indian Institute of Technology - Kanpur
Contents
Motivation
There is a freeware software called Visual3,
developed by MIT Fluid Dynamics Research
Laboratory, for post processing purposes. This was used by Dr. Sanjay
Mittal of Aerospace Dept. of IIT Kanpur. But the software had problems.
Like it was not user friendly and required a lot of memory. Moreover it
required workstations of high configurations like OpenGL, 128MB Ram, 24
bit Color monitor etc, which were not available in IITK. So he asked us
to make a post processor which can help him in his research and will solve
the above mentioned problems. Hence work for a 2D as well as 3D post processor
started. Later on this post processor was also used by Dr. Gautam Biswas
and Dr. K. Murlidhar of the Computational Fluid Dynamics Lab of Mechanical
Dept. IIT Kanpur.
Introduction
Post Processor, as the name suggests, is a software for
post processing purposes developed by Mukul and Me. This can perform functions
like contour, isosurface, vector plotting, sectioning, volume rendering,
etc. This takes in data of the domain in the form of a grid, which can
be structured or unstructured, with triangular or quadrilateral elements
in 2D and their equivalents in the 3D.
Example
Take an example of a square plate made of metal which is
heated from below. Problem is to study the temperature distribution in
the plate. The whole problem can be broken into three steps -
Pre Processing - In this step, problem is defined
by working out the known and unknown variables. By deciding on the type
of equations to be used etc. The important part of this step is to decide
the domain and then distritize it, by generating a grid for it, either
structured or unstructured.
Processing - The results are evaluated for the problem
by solving the known equations like the heat equation or the Navier Stroke
equation, using some well defined numerical method like the FEM or FDM
etc. on the node points of the grid.
Post Processing - This step involves inspection and
interpretation of the results, using some visual method for the purpose.
Methodology
As already told, this post processor works on a domain which
is discritized and a mesh has been generated for it. Then through any computational
method like, finite element or finite volume, the domain has been solved.
Hence the following three sets of data are already known
The grid node points - x,y and z.
The connectivity of grid elements.
The degree of freedom data like pressure, temperature etc.
on node points.
The number of points, elements and number of degree of
freedoms are also known.
The grid can be following type
Structured grid
- Body fitted geometry
- Square geometry
Unstructured grid
The grid element can be of following two type
Parallelopiped (Quadilateral in 2D)
Tetrahedron (Triangle in 2D)
Seperate modules for contour plotting (on sectioned
planes if in 3D), isosurface (only in 3D), vector plotting, sectioning
(in 3D), volume rendering (in 3D) and shading (on sectioned planes in 3D)
etc. have been developed and can be called from the main module. Some very
good algorithms have been developed for sectioning and volume rendering
purposes.
The final output is colored for which a color map can
also be defined. But by default a color scheme with red for the maximum
value and blue for the minimum value is used.
Results

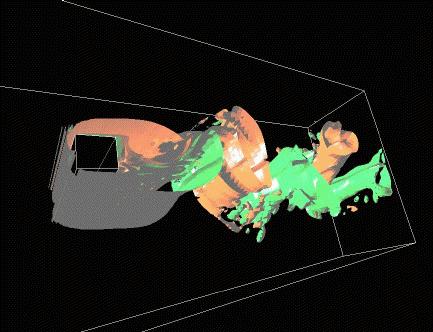
Isosurfaces for two different values with lighting effects
This code has been extensively used by us and others here
in IIT Kanpur, for a period of two years now. Computational Fluid Dynamics
Laboratories of both Aerospace as well as Mechanical Engineering have used
this program. The results shown below have only been graphically simulated
using this software by different people, but mostly by us. The results
belong to different people who are either Professors or Ph.D. students
in the above mentioned departments. The work has been split into seperate
pages for the convinence.
Have a look at these pages
Arun Kumar Saha, Dr. Gautam Biswas
- 2D work
- 3D work
Debashish Misra, Dr. K. Murlidhar
- 3D work
P. K. Maji, Dr. Gautam Biswas
- 3D work
Dr. Sanjay Mittal
- 2D work
- 3D work
The Code
We started to work on this project in second year at IIT
Kanpur, and still we think we are only half way through. So you imagine
how ambitious this project is.
The code has been developed mostly in C language, but
few parts are in C++ also. OpenGL
has been used for graphics. We are able to compile and run the program
on almost any platform, even on a PC with Linux using Mesa
graphics, which is a clone of OpenGL and is a freeware.
First we started with one version for both 2D and 3D.
Later 2D and 3D version were seperated. 2D Version is now called
2Dpro
and
3D
Version is called postpro ( large RAM requirement, but fast
) and smallpro ( small RAM requirement, but slow ).
Soon we do plan to put the executables here on the Web,
once the documentation for the code is ready.
If you want a copy of the program email me at [email protected]
Scope for Improvement
User Interface is not ready at the moment. Though pull down
menus on mouse buttons are available. Very soon user interface will also
be developed using either tcl/tk or glut libraries.
No documentation available for the software on how to use
it or how to define the input etc. As the code will develop we do hope
to write something for it.
References
MIT Fluid Dynamics Research Lab : http://raphael.mit.edu
OpenGL Official Website : http://www.sgi.com/software/opengl
Mesa Website : http://www.ssec.wisc.edu/~brianp/Mesa.html
This project was made by Mukul Gupta and Apurva
Prakash in the May, 1997. (Guide : Dr. Sanjay Mittal)
This page was last updated on 16th November, 1998

